
GEOG 1610: Stream erosion and reservoir sedimentation in North-Central Texas.
For a printable answer sheet click here.
This virtual field trip examines evidence of erosion in the drainage basin of Denton Creek, which drains portions of Montague, Wise and Denton counties. Clastic sediment sources in the drainage basin include rills, gullies and channel bank and bed erosion. Sediment eroded from the drainage basin is deposited into Grapevine Lake which was created in 1952 by damming Denton Creek. The map below (Fig. 1) is an extract from a U.S.G.S. geology map showing the location of the field trip sites.
Figure 1. Drainage basin of Denton Creek (bold black line). Numbers 1-7 refer to
field trip sites described below. Blue dashed line separates sandstone bedrock
underlying the northern portion of the drainage basin from limestone bedrocks
underlying the southern portion. Yellow and orange colors indicate stream
floodplain deposits.
Site 1. Gullies and Rills on a
Sandstone Hillside.
The combination of heavy rain (for example during spring thunderstorms) and
sandy ground with low permeability causes surface run-off and erosion in the
northern portion of the drainage basin. The erosion creates large gullies and
smaller rills (Figs. 2 & 3).
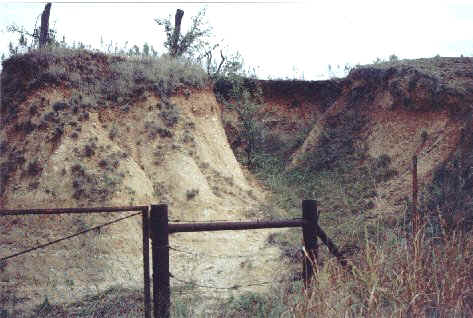
Figure 2. Gully, about 2 meters deep, in sandy soil at site 1.
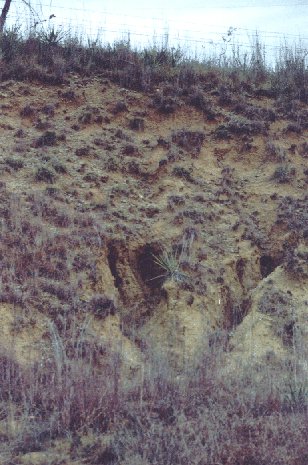
Figure 3. Rills (small channels eroded by surface run-off) on steeply sloping
sandy soil at site 1. The rills are about 15 cm wide and up to 30 cm deep.
Sites 2 & 3. Stream Bank and
Bed Erosion in an area of Limestone Bedrock.
Limestone bedrocks in the drainage basin produce dark clayey soils. The
steep banks of small streams at sites 2 & 3 are evidence of bank erosion
(Figs. 4 & 5).
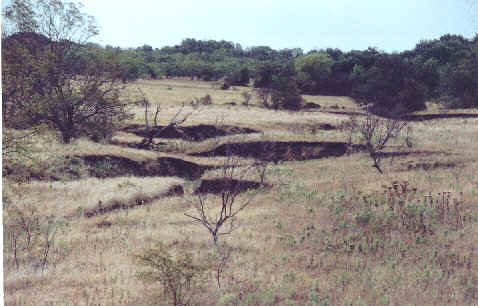
Figure 4. Steep stream banks visible at site 2. The banks are about 1 meter
high.
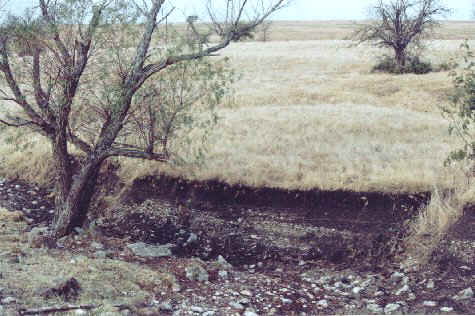
Figure 5. Steep stream bank at site 3. Fragments of the underlying limestone
bedrock are exposed in the stream bed, indicating bed erosion.
Site 4. Large Gullies on Sandstone
Bedrock.
Some gullies have grown particularly large in the northern portion of the
drainage basin. In some cases multiple gullies form branches of large system of
gullies (Figs. 6 & 7).
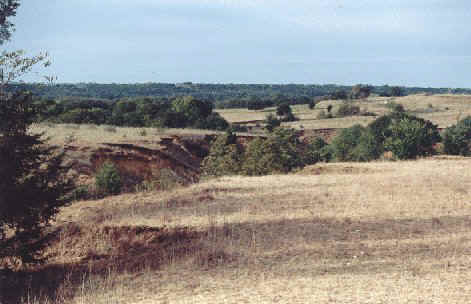
Figure 6. One branch of a large gully system at site 4. This gully is up to 40
meters wide and about 20 meters deep. Mature trees are visible growing up from
the gully floor.
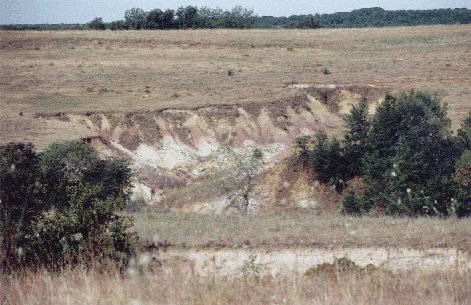
Figure 7. View of large gully near site 4.
Site 5. Denton Creek on Sandstone
Bedrock.
The small streams, rills and gullies, such as those viewed at sites 1-4, all
feed into Denton Creek - the main stream of the drainage basin. The creek
carries water and sediment down to Grapevine Lake (Figs. 8 & 9).
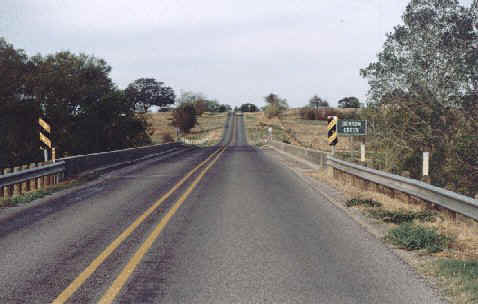
Figure 8. The Highway 51 road bridge over Denton Creek at site 5.
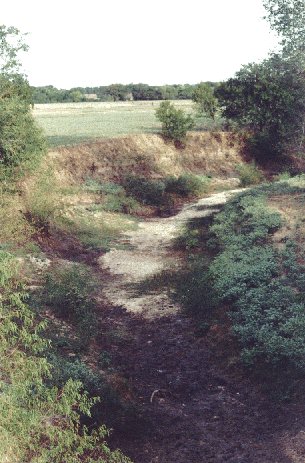
Figure 9. View of Denton Creek from the road bridge. The channel has steep sandy
banks and a flat sandy bed. The steep banks are evidence of ongoing bank erosion
(during high stream flows). The flat grassy area in the distance is the creek's
floodplain, constructed from sandy stream sediment (alluvium) eroded from upstream (including the
gullied area at site 4). This floodplain is one of the areas shown in yellow on
Fig. 1.
Site 6. Denton Creek on Limestone
Bedrock.
Although Denton Creek is underlain by limestone bedrock at site 6 (Fig. 1), the
channel still has steep sandy banks and a flat sandy bed because it is an alluvial
channel - the creek runs
through its own deposits of sand transported from the northern portion of the
drainage basin (Figs. 10 & 11).
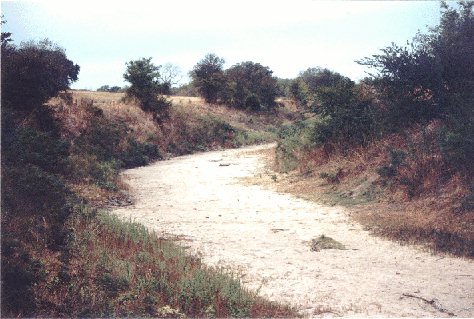
Figure 10. Denton Creek at site 6. The sand in the creek bed is transported
downstream when sufficiently high stream flows occur.
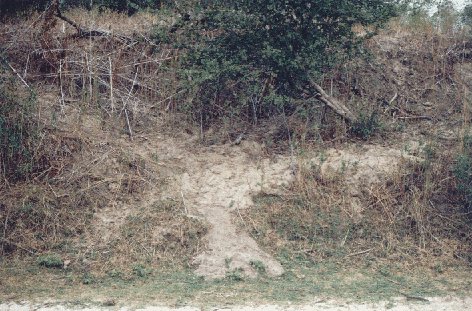
Figure 11. A small earthflow caused by recent heavy rain on the bank of the
creek at site 6. This, and the fallen tree just above the earthflow, is evidence
of ongoing bank erosion.
Site 7. Denton Creek at Grapevine
Lake.
Denton Creek at the head of Grapevine Lake appears much the same as in other
parts of the drainage basin - steep sandy banks and a flat sandy bed (Fig. 12).
As at site 6, the creek is running through its own deposits of sandy sediment.
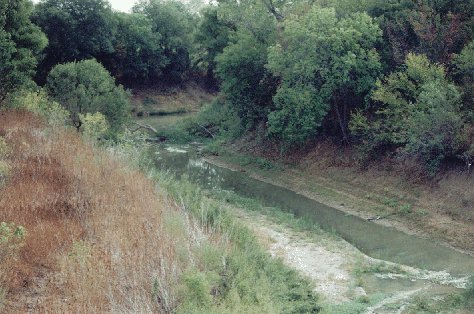
Figure 12. Denton Creek at the head of Grapevine Lake. The fallen trees in the
channel are evidence of recent bank erosion.
Field Measurement of Water Flow
and Sediment Transport.
A. Stream Discharge (Q): The volume of water flowing through the creek (or
discharge) can be calculated by multiplying the cross-sectional area of flow (A)
by the mean flow velocity (V). The cross-sectional area of flow can be found by
simply measuring the depth of the stream at regular intervals (e.g. 1 meter)
across the channel. In the lab, these measurements can be plotted on graph paper
and the cross-sectional area can be calculated.
Mean flow velocity can be measured by a flow velocity meter (Figs. 13 & 14).
Usually a number of measurements are collected from different positions across
the stream and then averaged to find the mean velocity.
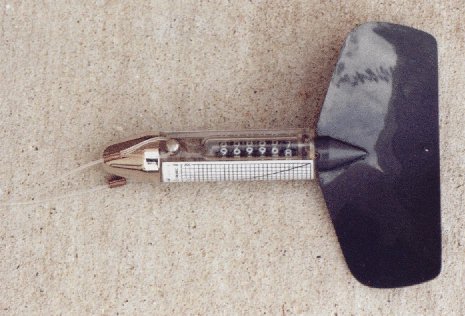
Figure 13. Flow velocity meter. The meter is suspended in the flowing water
which turns the propeller; the propeller operates a counter (visible through the
plastic window).
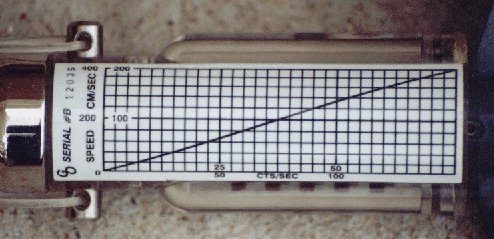
Figure 14. Flow velocity meter calibration graph. The counts per second recorded
by the flow velocity meter are converted into a flow velocity in cm per second
by the calibration graph.
B. Suspended Sediment Load (Ss): sediment is supplied to Denton Creek by rill erosion, gully erosion and channel erosion (bank and bed). Fine sediment (clay and silt) is usually suspended in the stream flow by turbulence. The amount of sediment suspended in the flow can be calculated by filtering the sediment out of a water sample of known volume (e.g. 1 liter). Filtering devices usually employ a vacuum pump to draw the water sample through an extremely fine-mesh filter (Fig. 15).
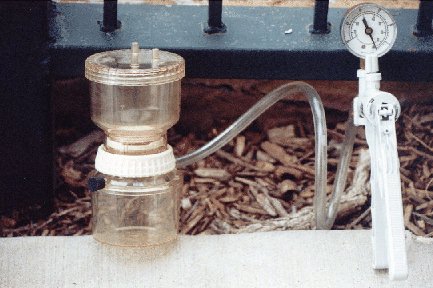
Figure 15. A suspended sediment filter chamber and vacuum pump.
Once the water is filtered, the filter can be removed, dried and weighed to obtain the suspended sediment concentration (usually in mg per liter) (Fig. 16). This concentration can then be multiplied by the stream discharge to find the total suspended sediment load.
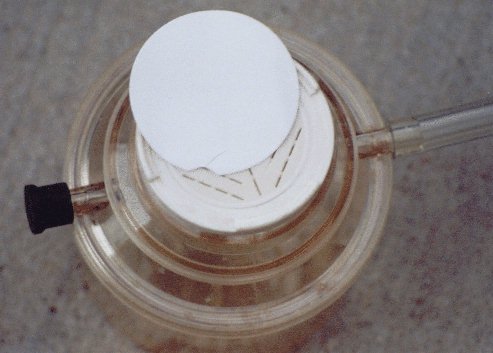
Figure 16. Close-up of the suspended sediment filter (round white disk).
C. Bed Sediment Load (Sb): coarse sediment (sand, gravel) that remains in contact with the stream bed as it is transported downstream (bed load) can be estimated mathematically. One approach is based on estimating the bed shear stress (the force exerted on the stream bed sediment by the flowing water) and the critical shear stress (the amount of force required to move stream bed sediment). Parameters for the mathematical equations that must be obtained in the field are the slope of the stream (which can be measured by surveyor's level) and the mean size and density of bed sediment (which can be found from a sample of sediment collected from the steam bed).