GEOG 4350 GEOMORPHOLOGY LAB 6. NORTH TEXAS FLOODPLAINS.
May 2015 was an unusually wet month in North Texas:
May
"normal" = 5.11" |
Date |
Rain |
|
5/05
5/06
5/07
5/08
5/09
5/10
5/13
5/17
5/20
5/21
5/22
5/23
5/24
5/25
5/26
5/27
5/28
5/29
5/30
Total |
0.12"
0.21"
2.14"
0.21"
0.43"
2.76"
0.94"
0.53"
0.50"
0.37"
0.03"
0.17"
0.95"
0.71"
0.50"
0.03"
1.08"
1.66"
2.10"
15.44" |
The rainfall total for the month was over 3 times the average for May
and was the all-time wettest month on record for Texas. Not
surprisingly, widespread flooding occurred throughout North Texas.

The Trinity River in Dallas, May 29, 2015.
In the Denton area, many creeks and rivers overtopped their banks and
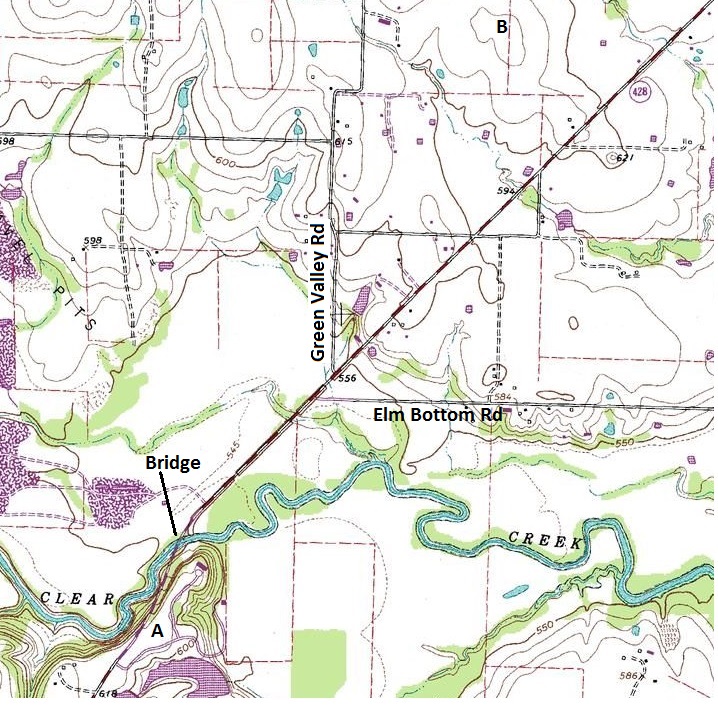
flooded their floodplains. The following images show a local example -
Clear Creek, a few miles northeast of Denton. Find Clear Creek and the
locations shown below on your map (note: A and B are the end
points of the topographic profile across Clear Creek).
CLEAR CREEK MAP:
These photographs were taken on May 20th, 2015.
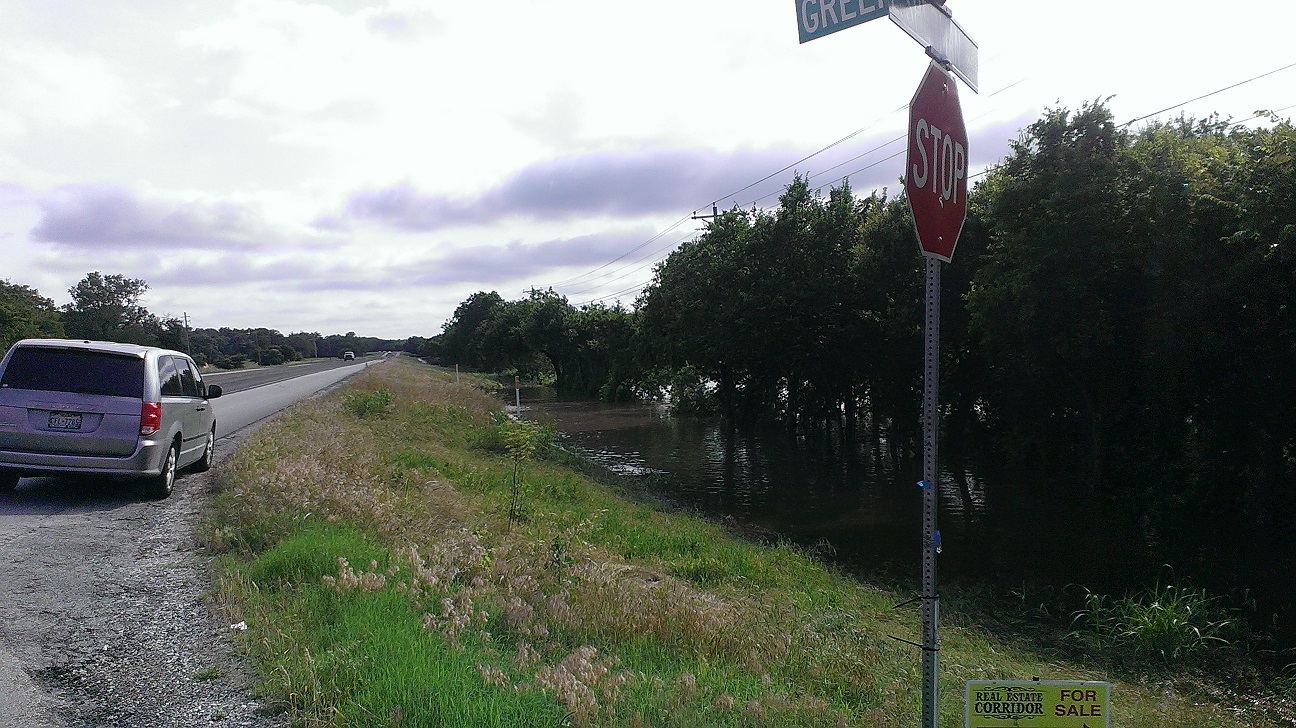
Intersection of Green Valley Rd and Sherman Drive (FM428) looking
southwest across floodplain. The road is elevated 2-3 m above the
floodplain (which is clearly flooded).
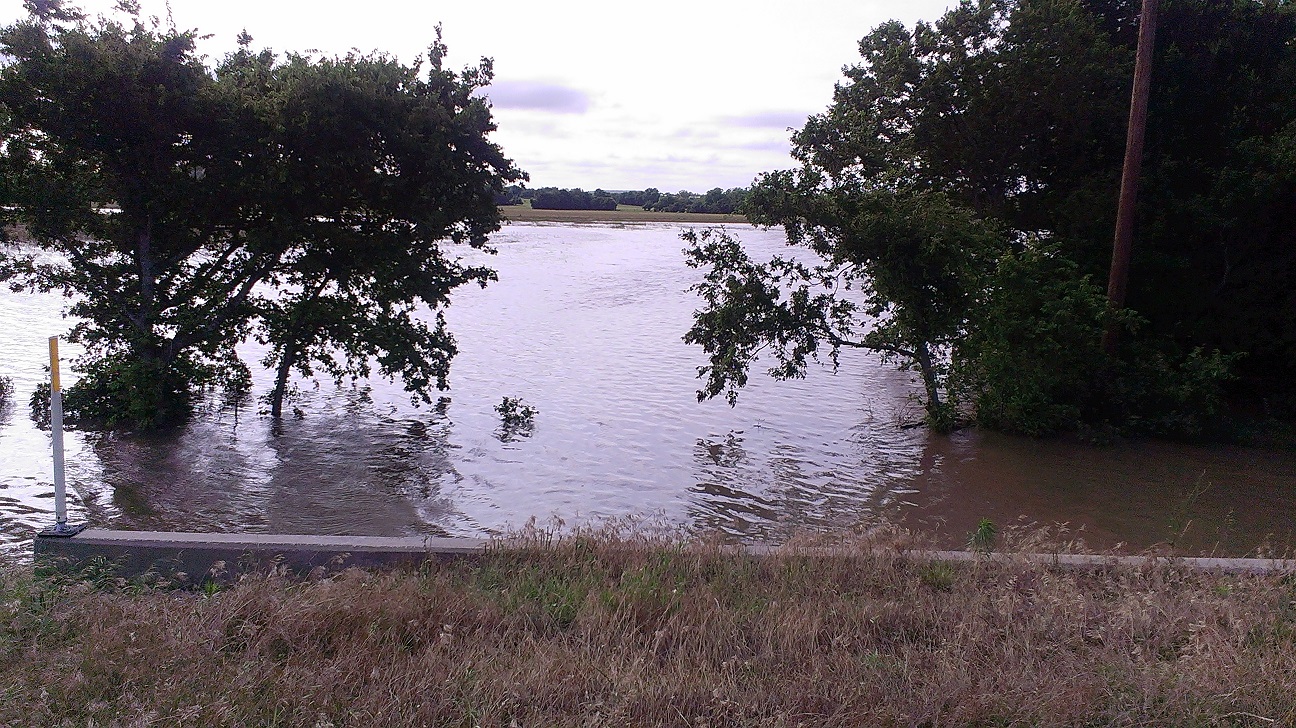
View west across floodplain from near location 1 above.
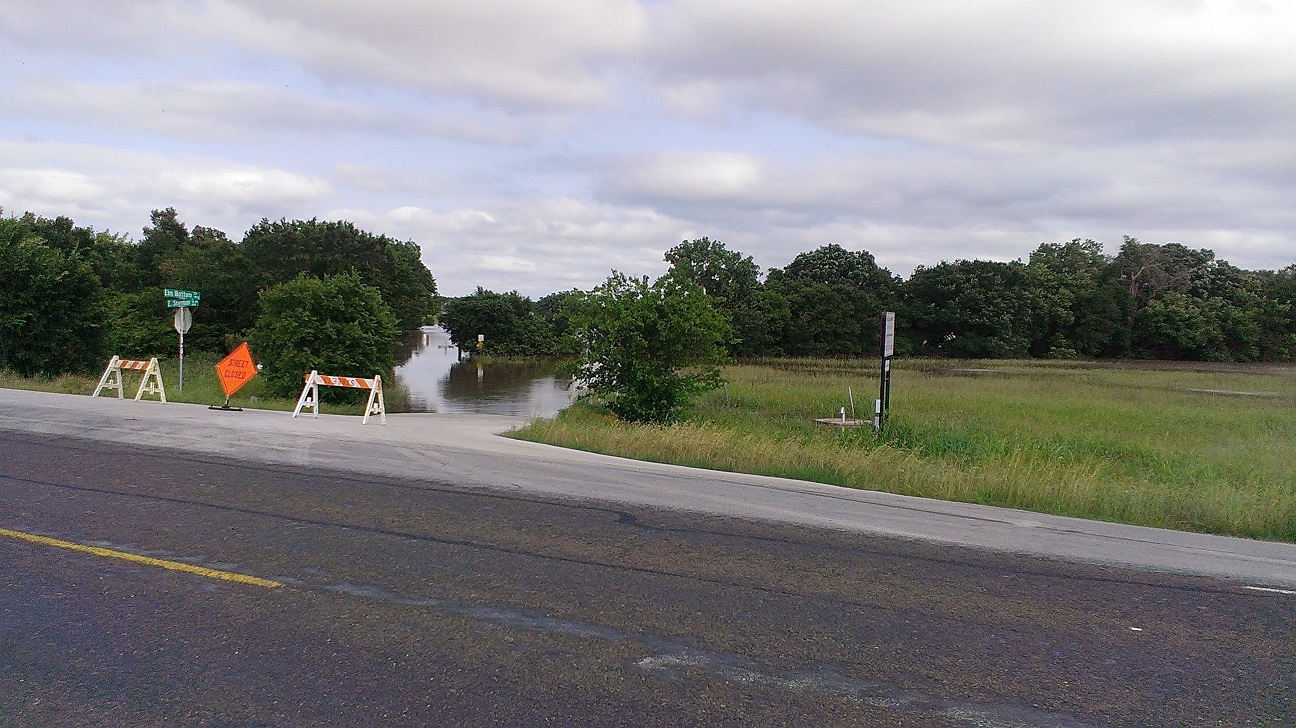
Elm Bottom Rd runs across the floodplain - here it is flooded and
closed.
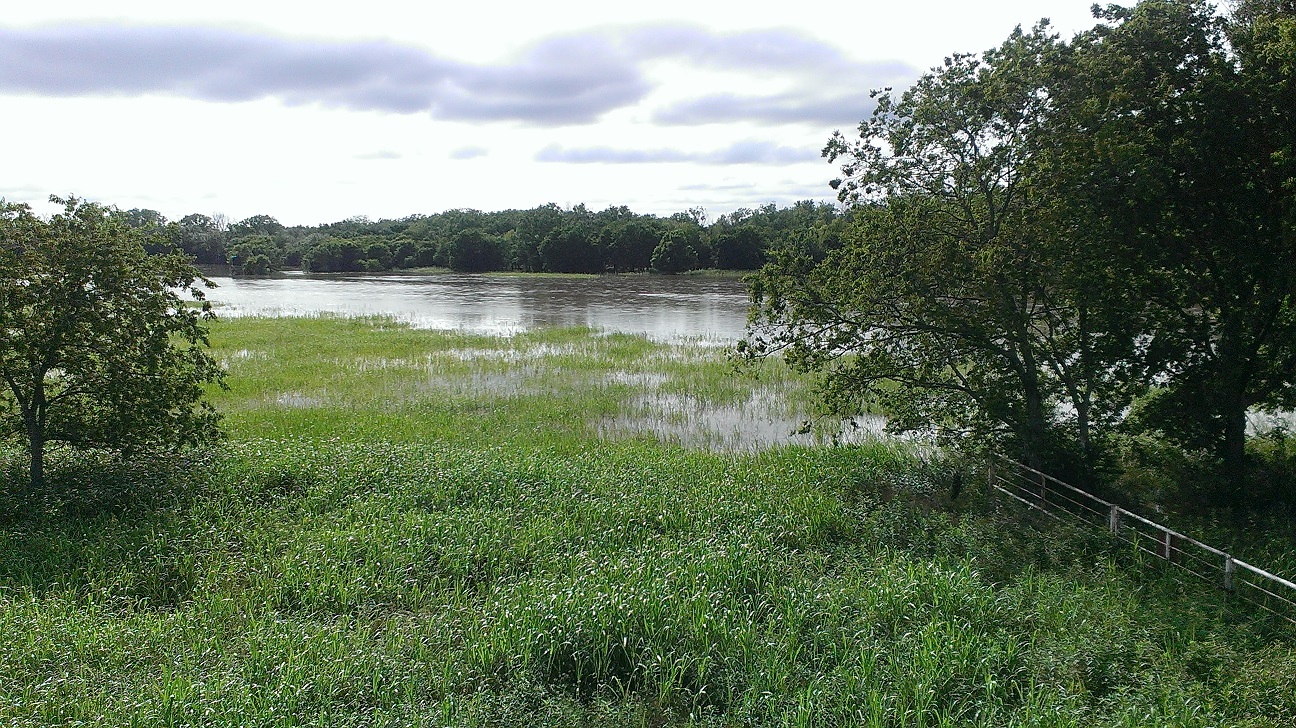
View east across the floodplain from half way across the floodplain.
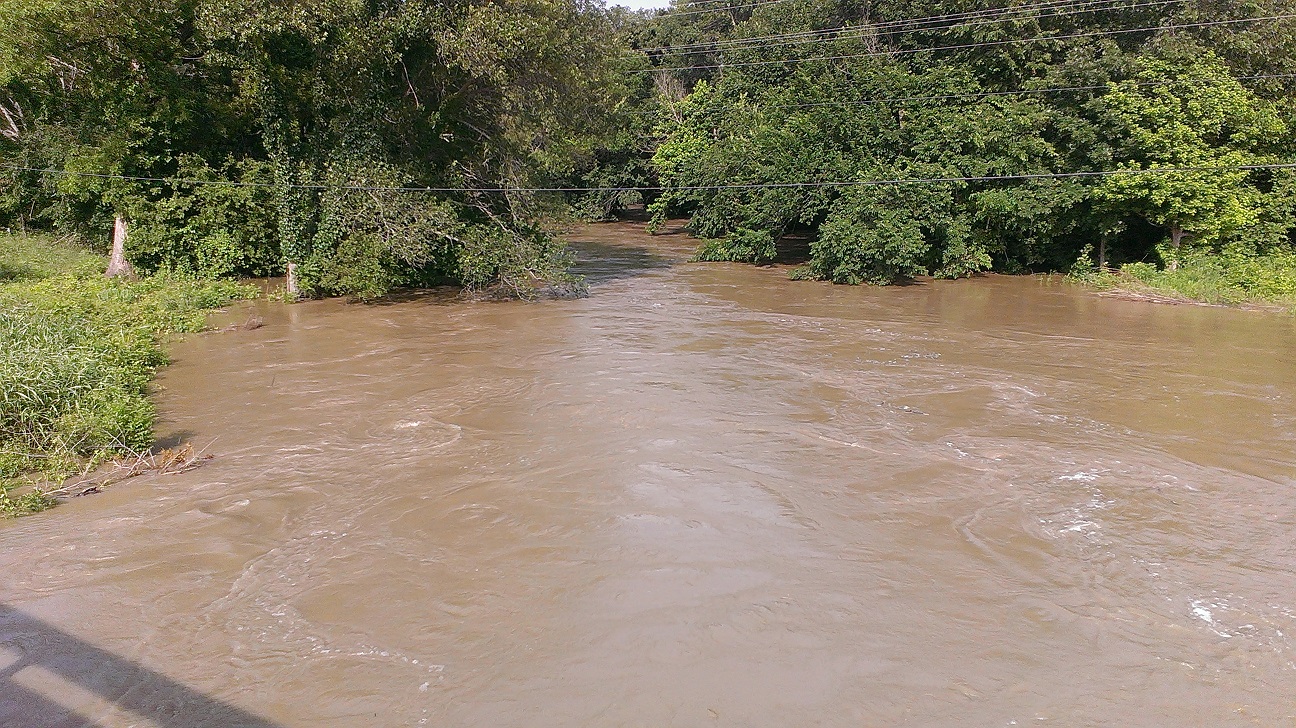
View of Clear Creek from the bridge.
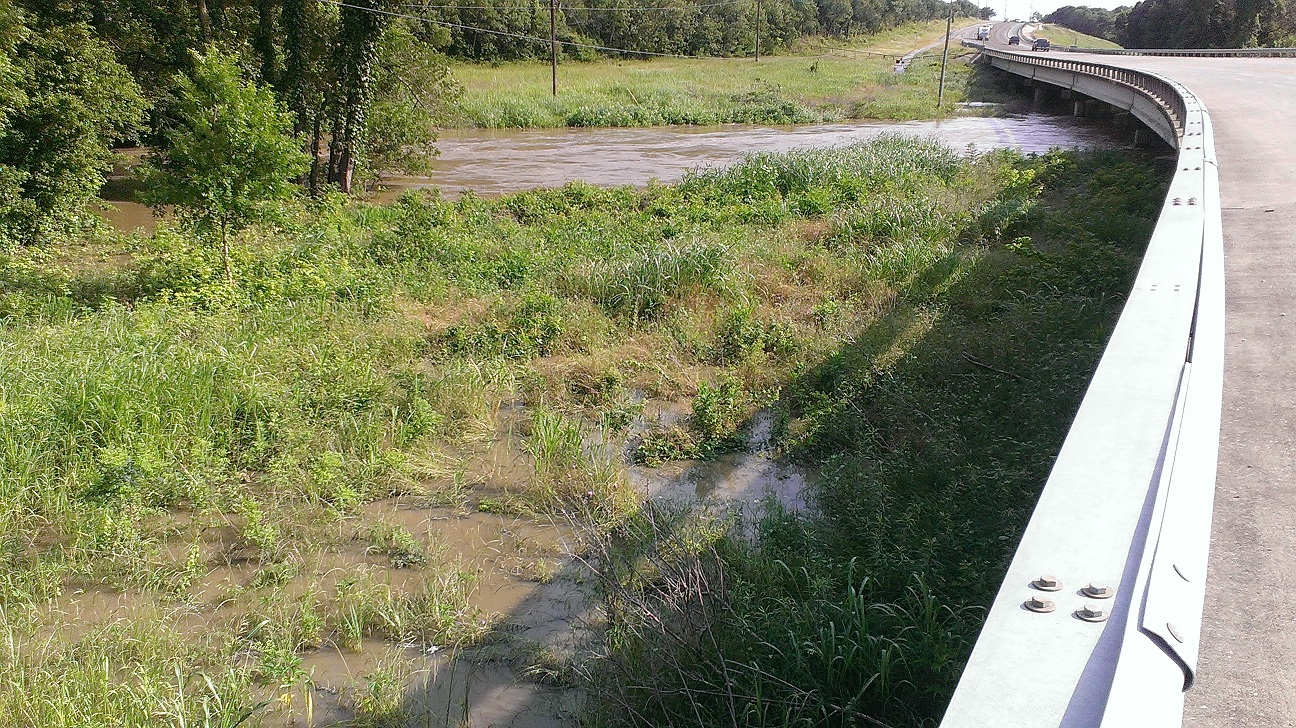
Another view of the bridge showing flood water spilling from the
channel over the floodplain.
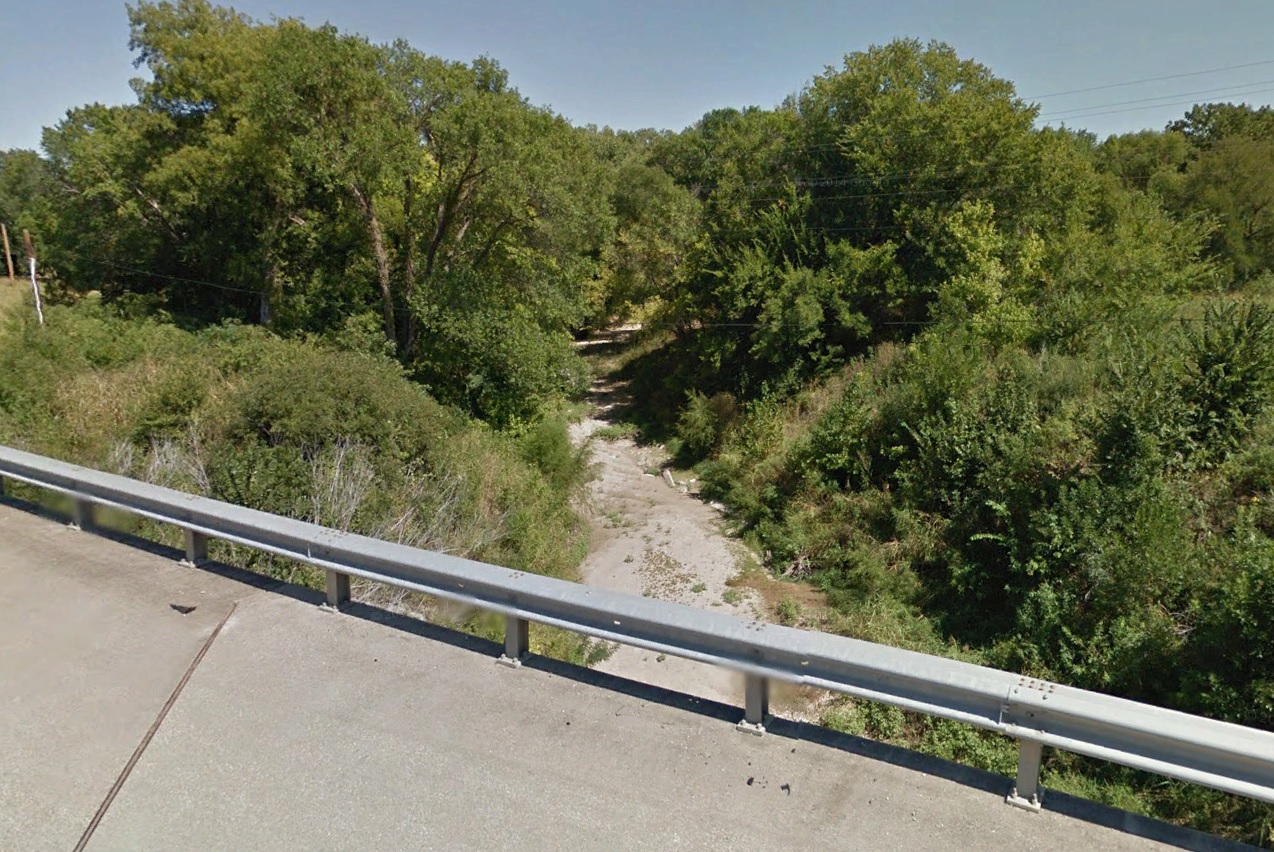
Clear Creek on a "normal" day (use the power lines to compare to the photos above).
ELM FORK OF THE TRINITY RIVER MAP:
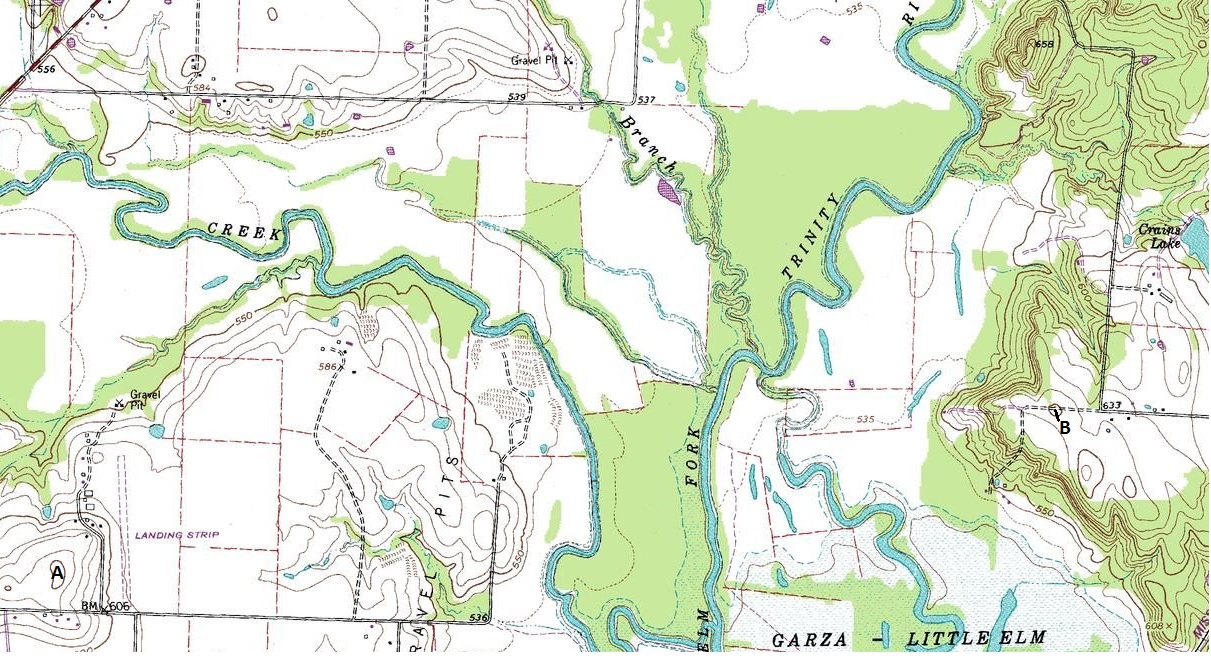
Map of the Elm Fork showing end points (A and B) of topographic profile.
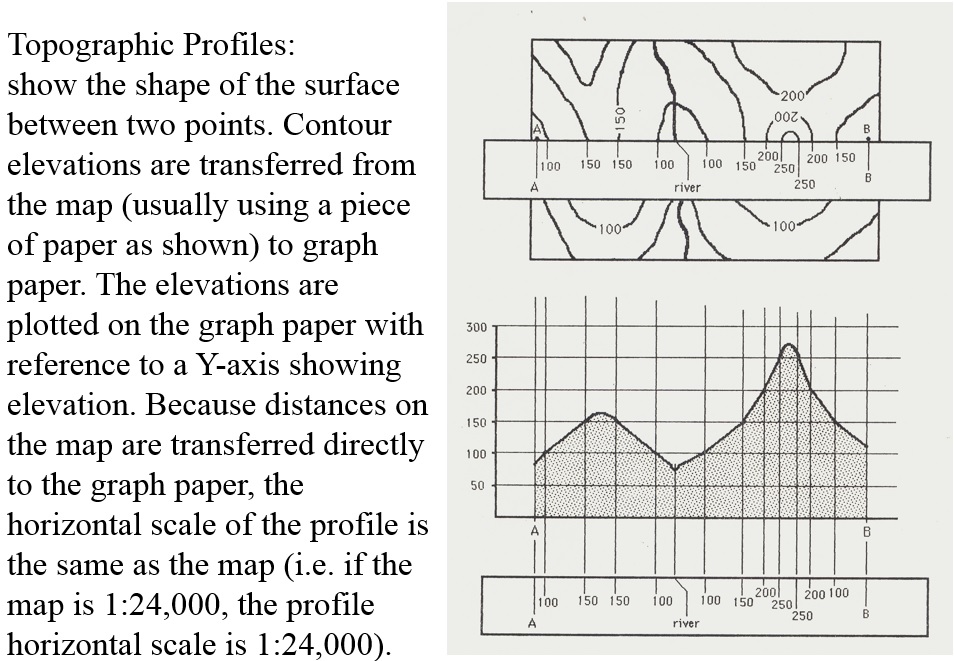
However,
unlike the map, the profile also has a vertical scale determined by the
Y-axis.
For
example if the Y-axis is 1 inch
= 200 feet, this is a vertical scale of 1:2,400
(1 inch = 2400 inches).
Because
of this, profiles usually have vertical
exaggeration (vertical
scale is larger than
horizontal scale). In the example above, the vertical exaggeration is
24,000/2,400 = 10x.
Back to GEOG 4350